
New research. What happened to giving in 2023?
CAF have just published their annual UK Giving report for 2024. That link takes you to the report so you can read it yourself. However for the busy and the geeks, I've produced two summaries. Below you'll find a top line summary and at the bottom there's a video where I share my thoughts on CAF's findings. I hope they're of use!
Top line summary
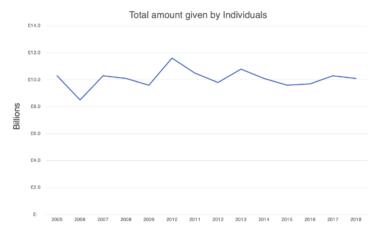
- Individual giving has jumped up to £13.9 billion from £12.7 Billion last year which means the IG giving gap has fallen to £3.5billion in real terms compared to 2005. I was worried that giving (which was boosted by giving following the invasion of Ukraine) would fall back this year, so this is particularly good news.
- The percentage of people giving has dropped back a little from last year, falling from 59% to 58%. But don't forget that it's down from 65% in 2019. So it definitely looks like those with the resources are giving more whilst a relatively small number of donors have stopped giving.
- The typical donation is still stuck at £20. This also highlights that those with resources are giving more. The Average gift is now £65 a month compared to just £46 in 2019. However, over 90% of all gifts to charity are under £100. Giving £500 or more puts a donor firmly in the most generous 1% of donors.
- Donors from the wealthiest areas are giving much less as a percentage of their wealth than donors from the least affluent parts of the UK. For example, donors from Kensington and Bayswater give just 0.5% of their household income to charity. Whereas donors from Belfast West donate 2.2% of their income. There is so much more potential to give amongst wealthier donors. This is a key area the sector should focus on.
- Londoners give less of their disposable income to charity (1.3%) compared to donors in Belfast (2.5%), Edinburgh (1.8%) or Cardiff (2.1%).
- The proportion of charitable donations given to disasters and overseas aid halved from a high of 14% last year to just 7% this year (this highlights the Ukraine effect from point one - it also shows that many people have switched their giving to other causes and not just cut back).
- Donors from areas where there is high trust in charities tend to give more than donors from areas where trust is low (I've got some good insight to explain this effect in tomorrow's video).
- CAF estimate there are just 1 million super givers who donate, sponsor people, volunteer, fundraise and give goods.
The video (featuring Mr. Burns from the Simpsons)
You'll see I mention the Charity Commission's research on trust in charities the video. The link will let you read the full report.


The Essentials

Crack the Code to Regular Giving: Insights, Strategies, and a Special Giveaway!
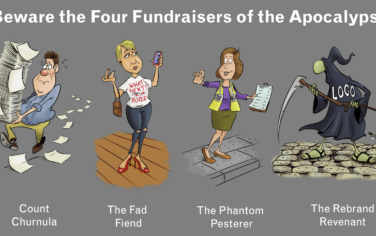
‘Tis Halloween. Keep to the light and beware the Four Fundraisers of the Apocalypse!
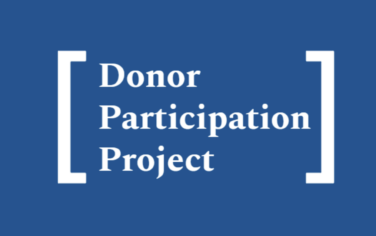
Why do people give? The Donor Participation Project with Louis Diez.
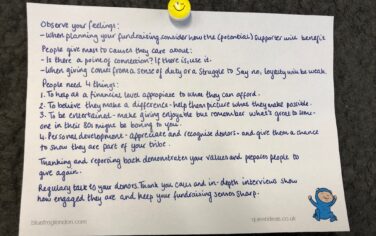
A guide to fundraising on the back of a postcard
What does the latest research tell us about the state of fundraising?