How the direct debit cycle works
I posted a piece last week on Rapidata's paper on what's happening to direct debits in the UK. It can be downloaded here.

"On average, the financial year starts in April with a cancellations rate that is lower than the eventual average for that year.
Cancellations rates then begin to increase over the summer, reaching a peak above the annual average in August/September before dipping below average again in November and December.
Rates rise above average again in January (as we have explained, this pattern is partly due to closure over Christmas and some December cancellations not being picked up until January) before dipping back below average in February and March for the cycle to begin again in the April of the next financial year."
3 Comments
Comments are closed.


The Essentials

Crack the Code to Regular Giving: Insights, Strategies, and a Special Giveaway!
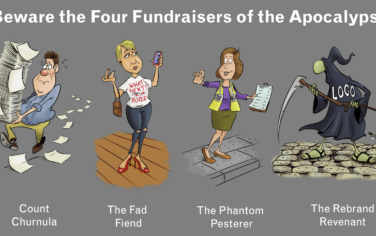
‘Tis Halloween. Keep to the light and beware the Four Fundraisers of the Apocalypse!

Why do people give? The Donor Participation Project with Louis Diez.
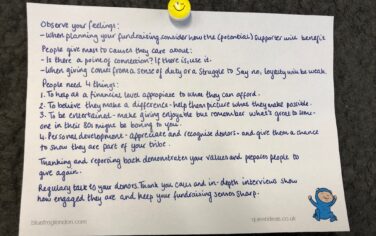
A guide to fundraising on the back of a postcard
What does the latest research tell us about the state of fundraising?
Has no-one else spotted an obvious, but not very useful, possible reason for this pattern?
Most charities front-load their regular giving recruitment programmes to April as it’s the start of the financial year and this increases campaign ROI within that financial year, keeping finance directors (deluded but) happy. As attrition rates naturally spike within the first few months, particularly with Face to Face & Telemarketing, this leads to increased attrition over the summer, with a break at Christmas for reasons already highlighted. During spring, attrition continues on a downward trend as fewer new donors with their higher cancellation rates are recruited. Then it all starts again at the beginning of the next financial year.
OK, so some big high-spending charities can afford to recruit all year-round, but most small to medium charities I suspect follow the above pattern.
So, trying to recruit new regular givers at Christmas will not decrease attrition, but just move the same cycle forward by six months.
Hi Ed
Thanks for the comment. It’s a good piece of insight. We’ve been looking at cancellation patterns and we are seeing evidence of what you describe. We’ll have some interesting charts on the difference between year one and two attrition patterns to share in the next few months.
It’s interesting to note that the month 13 bump in attrition rates would also increase the cancellation rates around the summer months adding weight to your theory.
That said, I think there are some other issues that we should also take into account.
1. The intake of a new range of novice face to face recruiters once the summer university term ends. These people start hitting the streets in June and July.
2. The fact that a huge amount of recruitment does happen at the start of the year means that a large number of requests for support hit at the same time. We know that some donors do cancel if they decide to start a new dd.
3. Any recruitment campaign needs to accompanied by a re-activation campaign that works to manage this peak. Strategically, this must be part of the recruitment campaign – not something tacked to fit in with the standard donor cycle.
We’ll update as and when we have the figures.
Thanks Mark – it’ll be interesting to see your new research.